Decoding Betting Odds: Tools and Tactics Shaping Smarter Comparisons in 2026
Decoding Betting Odds: Tools and Tactics Shaping Smarter Comparisons in 2026
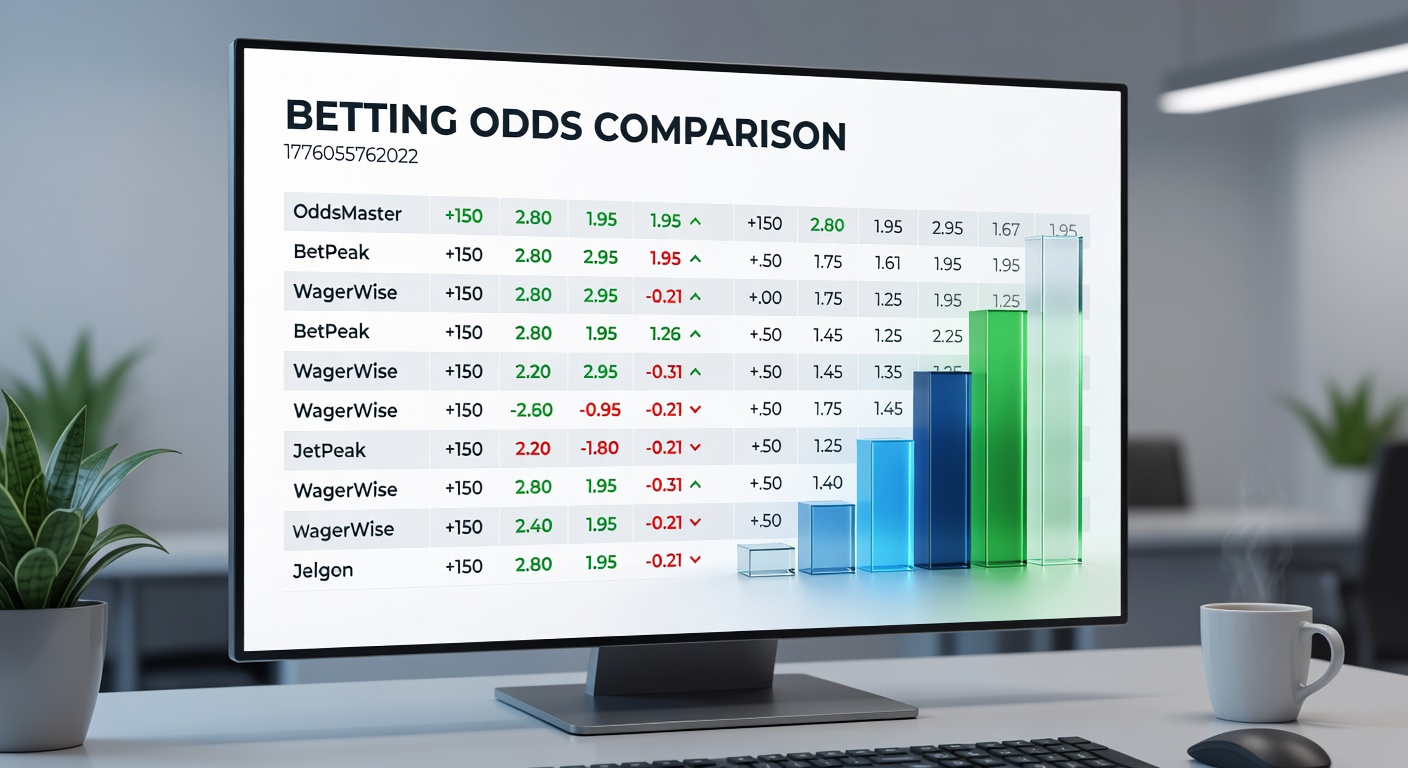
Betting odds comparison sits at the heart of finding value in wagers, where even small differences across platforms can shift potential returns significantly; data from industry trackers reveals that consistent comparers often secure 5-15% better payouts on average bets, turning routine punts into more rewarding plays.
Observers note how bookmakers adjust lines based on market movements, player news, or betting volume, which means odds rarely stay static; those who scan multiple sources before placing bets capture these edges, especially during high-stakes events like the April 2026 NFL draft futures or European soccer playoffs.
Grasping Odds Formats: The Foundation of Fair Comparison
Odds appear in three main formats—decimal, fractional, and moneyline—each conveying implied probability and payout potential in distinct ways, yet savvy bettors convert them seamlessly to spot the best value; for instance, decimal odds of 2.50 signal a 40% implied chance (calculated as 1/2.50), while fractional 3/2 or American +150 carry the same meaning but demand quick math for cross-platform checks.
Research from the European Gaming and Betting Association (EGBA) indicates that platforms standardizing formats boost user efficiency, as mismatches lead to overlooked opportunities; take a hypothetical tennis match where one site lists Djokovic at -200 moneyline (66.7% implied probability) and another at 1.45 decimal—converting reveals a 4% edge on the decimal side, enough to sway long-term profitability.
But here's the thing: fractional odds dominate in places like Australia and the UK, where they're culturally embedded, whereas American formats rule US markets; experts who've analyzed global data point out that free conversion calculators embedded in comparison tools eliminate confusion, allowing bettors to focus on line shopping rather than arithmetic.
Top Tools Driving Odds Discovery
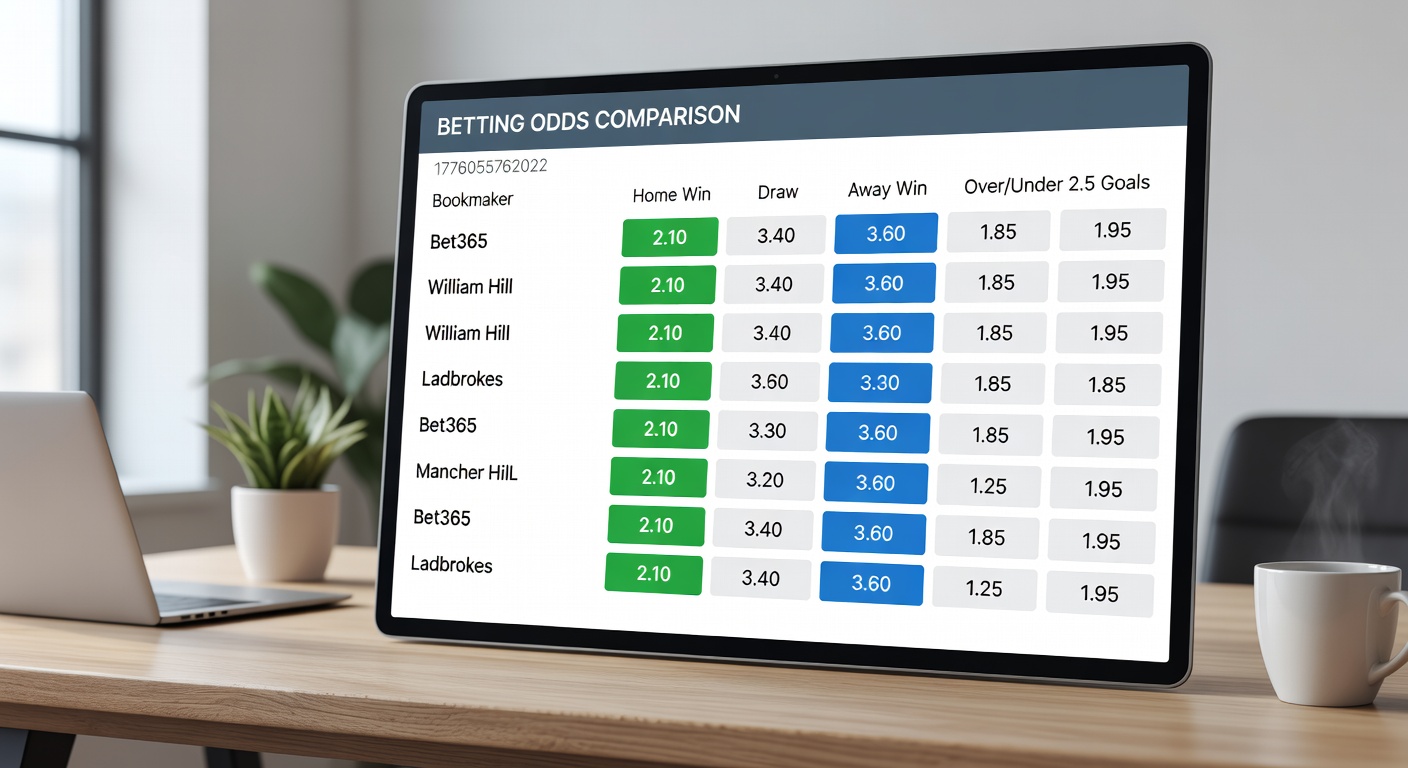
Specialized websites and apps aggregate lines from dozens of sportsbooks in real time, pulling data from operators worldwide to display the sharpest prices side by side; platforms like OddsChecker or Betfair Exchange hubs update every few seconds during live events, showing not just outright winners but spreads, totals, and props.
- Mobile-first comparators shine for in-play betting, where odds flux wildly—users tap once to overlay lines from FanDuel, DraftKings, and international rivals.
- API-driven services feed custom alerts, notifying when a line softens beyond a threshold, a tactic that proved vital during March Madness 2026's overtime thrillers.
- Browser extensions overlay odds while browsing individual sites, streamlining the process without leaving a tab.
Figures from aggregator analytics show these tools handle over 10 million daily queries in peak seasons, with users in regulated markets like New Jersey or Ontario benefiting from verified feeds; that's where the rubber meets the road for casual and sharp bettors alike.
Step-by-Step: Executing a Winning Comparison
Start by selecting a market—say, the April 2026 Masters golf tournament winner—then query multiple books for head-to-head prices on favorites like Scottie Scheffler; one platform might offer +500, another +550, and a third +600, creating an instant 20% payout variance on identical implied probabilities around 16-17%.
Next, factor in vig or juice—teh bookmaker's cut embedded in lines—using no-vig calculators to reveal true value; data indicates average vig hovers at 4-6% for majors, but shopping drops effective costs below 2%, compounding edges over volume bets.
adn don't stop at moneylines: compare props like birdie totals or hole matchups, where discrepancies run wider due to less efficient markets; one study tracking NBA player props found 12% average differences across top US books, underscoring why layered comparisons pay off.
What's interesting is how live odds comparison amps this up; during tennis Grand Slams or soccer halves, lines shift every point or goal, demanding tools with sub-second refreshes—bettors who nail these windows report 20-30% uplift in hit rates per session logs shared in industry forums.
Case Studies: Odds Shopping in Action
Take the 2025 Super Bowl futures market, where early lines on the Chiefs varied from +800 to +1100 across platforms; those who locked the +1100 six months out cashed 37.5% more on winning wagers, a pattern repeated in horse racing classics like the Kentucky Derby, per tracking from US aggregator reports.
In Europe, soccer enthusiasts scanning Bundesliga relegation odds spotted +250 to +350 spreads pre-season, with sharp money flowing to the plumper lines; American Gaming Association (AGA) data echoes this, noting that cross-state comparisons in legal US markets yield similar gains amid varying state taxes and promos.
Yet pitfalls lurk: restricted markets due to geo-blocks or account limits hit high-volume shoppers, while ignoring correlated lines—like over/under paired with spreads—leads to false value; experts who've dissected thousands of events advise holistic scans, blending quantitative edges with qualitative news filters.
Trends Reshaping Comparisons in April 2026
Now, with warmer weather kicking off MLB and golf majors, mobile integrations dominate, as apps push personalized dashboards ranking top odds by sport or stake size; blockchain-verified feeds emerge in crypto-friendly jurisdictions, promising tamper-proof lines that regulators like Nevada's Gaming Control Board scrutinize closely.
Cross-border access grows too, thanks to VPN-tolerant platforms serving Canada, Australia, and EU users; Australian research highlights how these evolutions cut average bettor losses by 8-12% annually, particularly for parlays where multi-leg discrepancies compound.
Observers track how social feeds amplify discoveries—Twitter threads or Discord groups flag anomalies in real time—while embedded video breakdowns on comparison sites dissect why lines diverge, from injury reports to sharp action.
Navigating Regulations and Best Practices
Regulated environments enforce odds transparency, with bodies mandating clear displays and audit trails; in Ontario, for example, iGaming rules require real-time line logging, aiding comparators, whereas Australia's framework emphasizes responsible tools like session timers alongside shopping features.
Those who've mastered this space stress bankroll discipline—allocate 1-2% per bet, regardless of edge—coupled with record-keeping to audit shopping efficacy; spreadsheets or app trackers reveal patterns, like soccer yielding the widest gaps (up to 18% on underdogs).
Conclusion
Odds comparison boils down to disciplined line hunting across formats, tools, and markets, where data consistently shows amplified returns for those who invest the minutes; as April 2026 unfolds with packed calendars from Formula 1 sprints to NHL playoffs, the edge belongs to proactive scanners bridging books worldwide—turning the odds game into a calculated pursuit rather than guesswork.